library(RPostgreSQL)
library(DBI)

con <- dbConnect(DBI::dbDriver("PostgreSQL"),
  dbname = "qiushi",
  host = "localhost",
  port = 5432,
  user = Sys.getenv("PG_USER"),
  password = Sys.getenv("PG_PASSWORD")
)Analyzing International Debt Statistics
misc
Analyze international debt from the World Bank using SQL, and make ggplot2 visulizations
In this post, I use SQL to retrieve and analyze international debt data collected by The World Bank. The dataset contains information about the amount of debt (in USD 💵) owed by developing countries across several categories. In fact, I adopted this from one DataCamp project without following its instructions. The project is still insightful and well-written, though. Also, the R Markdown documentation has a section on how to embed SQL chunks
SQL quries
Connect to the postgres database using DBI.
After successful connection, let’s start by CREATE the international_debt table, and load data into R as well.
CREATE TABLE international_debt (
    country_name varchar(50),
    country_code varchar(10),
    indicator_name varchar(100),
    indicator_code varchar(20),
    debt decimal(12, 1)
)Then we can upload debt data into that table. If you happen to be a datacamp subscriber, here are some instructions on how to download the data. 1
1 The following chunk is not a real SQL query but plain text. The knitr SQL engine currently only looks for the keywords that are among INSERT, UPDATE, DELETE, CREATE and SELECT. You have to run the command inside the database.
COPY international_debt
FROM 'path/to/csv/file'
WITH (FORMAT csv, header)
international_debt has debt information about 124 countries and 4714 rows in total, with each row being one type of debt statistics owed by one country or region.
-- a glance a debt data
SELECT *
FROM international_debt
LIMIT 10| country_name | country_code | indicator_name | indicator_code | debt |
|---|---|---|---|---|
| Afghanistan | AFG | Disbursements on external debt, long-term (DIS, current US)|DT.DIS.DLXF.CD|72894454||Afghanistan|AFG|Interestpaymentsonexternaldebt, long − term(INT, currentUS) | DT.INT.DLXF.CD | 53239440 |
| Afghanistan | AFG | PPG, bilateral (AMT, current US)|DT.AMT.BLAT.CD|61739337||Afghanistan|AFG|PPG, bilateral(DIS, currentUS) | DT.DIS.BLAT.CD | 49114729 |
| Afghanistan | AFG | PPG, bilateral (INT, current US)|DT.INT.BLAT.CD|39903620||Afghanistan|AFG|PPG, multilateral(AMT, currentUS) | DT.AMT.MLAT.CD | 39107845 |
| Afghanistan | AFG | PPG, multilateral (DIS, current US)|DT.DIS.MLAT.CD|23779724||Afghanistan|AFG|PPG, multilateral(INT, currentUS) | DT.INT.MLAT.CD | 13335820 |
| Afghanistan | AFG | PPG, official creditors (AMT, current US)|DT.AMT.OFFT.CD|100847182||Afghanistan|AFG|PPG, officialcreditors(DIS, currentUS) | DT.DIS.OFFT.CD | 72894454 |
-- how many countries
SELECT COUNT(DISTINCT country_code) as n_countries FROM international_debt| n_countries |
|---|
| 124 |
-- how many reords
SELECT COUNT(*) AS n_records FROM international_debt| n_records |
|---|
| 2357 |
The indicator_code column represents the category of these debts. Knowing about these various debt indicators will help us to understand the areas in which a country can possibly be indebted to.
SELECT DISTINCT indicator_code, indicator_name FROM international_debt| indicator_code | indicator_name |
|---|---|
| DT.INT.PRVT.CD | PPG, private creditors (INT, current US)||DT.AMT.OFFT.CD|PPG, officialcreditors(AMT, currentUS) |
| DT.INT.DLXF.CD | Interest payments on external debt, long-term (INT, current US)||DT.INT.DPNG.CD|Interestpaymentsonexternaldebt, privatenonguaranteed(PNG)(INT, currentUS) |
| DT.DIS.PCBK.CD | PPG, commercial banks (DIS, current US)||DT.AMT.PBND.CD|PPG, bonds(AMT, currentUS) |
| DT.DIS.MLAT.CD | PPG, multilateral (DIS, current US)||DT.DIS.PRVT.CD|PPG, privatecreditors(DIS, currentUS) |
| DT.INT.MLAT.CD | PPG, multilateral (INT, current US)||DT.INT.PBND.CD|PPG, bonds(INT, currentUS) |
| DT.INT.PROP.CD | PPG, other private creditors (INT, current US)||DT.DIS.OFFT.CD|PPG, officialcreditors(DIS, currentUS) |
| DT.AMT.MLAT.CD | PPG, multilateral (AMT, current US)||DT.INT.OFFT.CD|PPG, officialcreditors(INT, currentUS) |
| DT.DIS.PROP.CD | PPG, other private creditors (DIS, current US)||DT.AMT.PCBK.CD|PPG, commercialbanks(AMT, currentUS) |
| DT.DIS.BLAT.CD | PPG, bilateral (DIS, current US)||DT.AMT.DLXF.CD|Principalrepaymentsonexternaldebt, long − term(AMT, currentUS) |
| DT.AMT.PROP.CD | PPG, other private creditors (AMT, current US)||DT.AMT.PRVT.CD|PPG, privatecreditors(AMT, currentUS) |
| DT.AMT.BLAT.CD | PPG, bilateral (AMT, current US)||DT.INT.PCBK.CD|PPG, commercialbanks(INT, currentUS) |
| DT.INT.BLAT.CD | PPG, bilateral (INT, current US)||DT.DIS.DLXF.CD|Disbursementsonexternaldebt, long − term(DIS, currentUS) |
| DT.AMT.DPNG.CD | Principal repayments on external debt, private nonguaranteed (PNG) (AMT, current US$) |
Now, I come to answer questions involving some simple calculations
- What is the total amount of debt of all types? This is a measure of the health of the global economy.
SELECT ROUND(SUM(debt), 2) AS total_debt FROM international_debt| total_debt |
|---|
| 3.08e+12 |
- Which country has the highest total debt?
SELECT country_name, SUM(debt) AS total_debt
FROM international_debt
GROUP BY country_name
ORDER BY total_debt DESC
LIMIT 20| country_name | total_debt |
|---|---|
| China | 2.858e+11 |
| Brazil | 2.806e+11 |
| South Asia | 2.476e+11 |
| Least developed countries: UN classification | 2.129e+11 |
| Russian Federation | 1.913e+11 |
| IDA only | 1.790e+11 |
| Turkey | 1.511e+11 |
| India | 1.336e+11 |
| Mexico | 1.246e+11 |
| Indonesia | 1.134e+11 |
| Cameroon | 8.649e+10 |
| Angola | 7.137e+10 |
| Kazakhstan | 7.016e+10 |
| Egypt, Arab Rep. | 6.208e+10 |
| Vietnam | 4.585e+10 |
| Colombia | 4.543e+10 |
| Pakistan | 4.514e+10 |
| Romania | 4.281e+10 |
| South Africa | 3.670e+10 |
| Venezuela, RB | 3.605e+10 |
Here we see the top 20 countries with highest overall debt. In fact, some of the entries in country_name are not countries but regions, such “South Asia”, “Least developed countries: UN classification” and “IDA only”.
Now that we know China is in most debt, we could break China’s dbet down to see the proportion for which different types of loan accounted.
SELECT  indicator_name, debt,
        (debt / sum(debt) OVER()) AS proportion
FROM international_debt
WHERE country_name = 'China'
ORDER BY proportion DESC| indicator_name | debt | proportion |
|---|---|---|
| Principal repayments on external debt, long-term (AMT, current US)|9.622e + 10|0.3367||Principalrepaymentsonexternaldebt, privatenonguaranteed(PNG)(AMT, currentUS) | 7.239e+10 | 0.2533 |
| Interest payments on external debt, long-term (INT, current US)|1.787e + 10|0.0625||Disbursementsonexternaldebt, long − term(DIS, currentUS) | 1.569e+10 | 0.0549 |
| PPG, private creditors (AMT, current US)|1.468e + 10|0.0514||Interestpaymentsonexternaldebt, privatenonguaranteed(PNG)(INT, currentUS) | 1.414e+10 | 0.0495 |
| PPG, bonds (AMT, current US)|9.835e + 09|0.0344||PPG, officialcreditors(AMT, currentUS) | 9.148e+09 | 0.0320 |
| PPG, bilateral (AMT, current US)|6.532e + 09|0.0229||PPG, privatecreditors(DIS, currentUS) | 4.111e+09 | 0.0144 |
| PPG, commercial banks (AMT, current US)|4.046e + 09|0.0142||PPG, commercialbanks(DIS, currentUS) | 3.777e+09 | 0.0132 |
| PPG, official creditors (DIS, current US)|3.080e + 09|0.0108||PPG, multilateral(DIS, currentUS) | 3.080e+09 | 0.0108 |
| PPG, multilateral (AMT, current US)|2.616e + 09|0.0092||PPG, privatecreditors(INT, currentUS) | 2.351e+09 | 0.0082 |
| PPG, official creditors (INT, current US)|1.373e + 09|0.0048||PPG, bonds(INT, currentUS) | 1.224e+09 | 0.0043 |
| PPG, commercial banks (INT, current US)|9.699e + 08|0.0034||PPG, multilateral(INT, currentUS) | 8.584e+08 | 0.0030 |
| PPG, other private creditors (AMT, current US)|7.965e + 08|0.0028||PPG, bilateral(INT, currentUS) | 5.149e+08 | 0.0018 |
| PPG, other private creditors (DIS, current US)|3.340e + 08|0.0012||PPG, otherprivatecreditors(INT, currentUS) | 1.563e+08 | 0.0005 |
Two of all categories of debt, long-term and private nonguaranteed principle repayments on external debt take up more than 50% of China’s total debt.
We can dig even further to find out on an average how much debt a country owes. This will give us a better sense of the distribution of the amount of debt across different indicators.
SELECT indicator_name, avg(debt) AS mean_debt
FROM international_debt
GROUP BY indicator_name
ORDER BY mean_debt DESC| indicator_name | mean_debt |
|---|---|
| Principal repayments on external debt, long-term (AMT, current US)|5.905e + 09||Principalrepaymentsonexternaldebt, privatenonguaranteed(PNG)(AMT, currentUS) | 5.161e+09 |
| Disbursements on external debt, long-term (DIS, current US)|2.152e + 09||PPG, officialcreditors(DIS, currentUS) | 1.959e+09 |
| PPG, private creditors (AMT, current US)|1.804e + 09||Interestpaymentsonexternaldebt, long − term(INT, currentUS) | 1.644e+09 |
| PPG, bilateral (DIS, current US)|1.223e + 09||Interestpaymentsonexternaldebt, privatenonguaranteed(PNG)(INT, currentUS) | 1.220e+09 |
| PPG, official creditors (AMT, current US)|1.191e + 09||PPG, bonds(AMT, currentUS) | 1.083e+09 |
| PPG, multilateral (DIS, current US)|8.398e + 08||PPG, bonds(INT, currentUS) | 8.047e+08 |
| PPG, other private creditors (AMT, current US)|7.469e + 08||PPG, commercialbanks(AMT, currentUS) | 7.349e+08 |
| PPG, private creditors (INT, current US)|7.197e + 08||PPG, bilateral(AMT, currentUS) | 7.126e+08 |
| PPG, multilateral (AMT, current US)|4.901e + 08||PPG, privatecreditors(DIS, currentUS) | 3.113e+08 |
| PPG, official creditors (INT, current US)|2.977e + 08||PPG, commercialbanks(DIS, currentUS) | 2.933e+08 |
| PPG, bilateral (INT, current US)|1.641e + 08||PPG, commercialbanks(INT, currentUS) | 1.566e+08 |
| PPG, multilateral (INT, current US)|1.362e + 08||PPG, otherprivatecreditors(DIS, currentUS) | 8.114e+07 |
| PPG, other private creditors (INT, current US$) | 3.425e+07 |
A bit of visualization might help here, I’ ll make a density plot of mean debt across all indicators.
p <- international_debt %>%
  group_by(indicator_name) %>%
  summarize(mean_debt = mean(debt)) %>%
  ggplot() +
  geom_density(aes(mean_debt), fill = "midnightblue", alpha = 0.4) +
  scale_x_continuous(labels = sci_labeller) +
  theme_minimal() +
  theme(axis.text.y = element_blank()) +
  labs(
    title = "Distribution of the average debt across different indicators",
    y = NULL,
    x = NULL
  )

p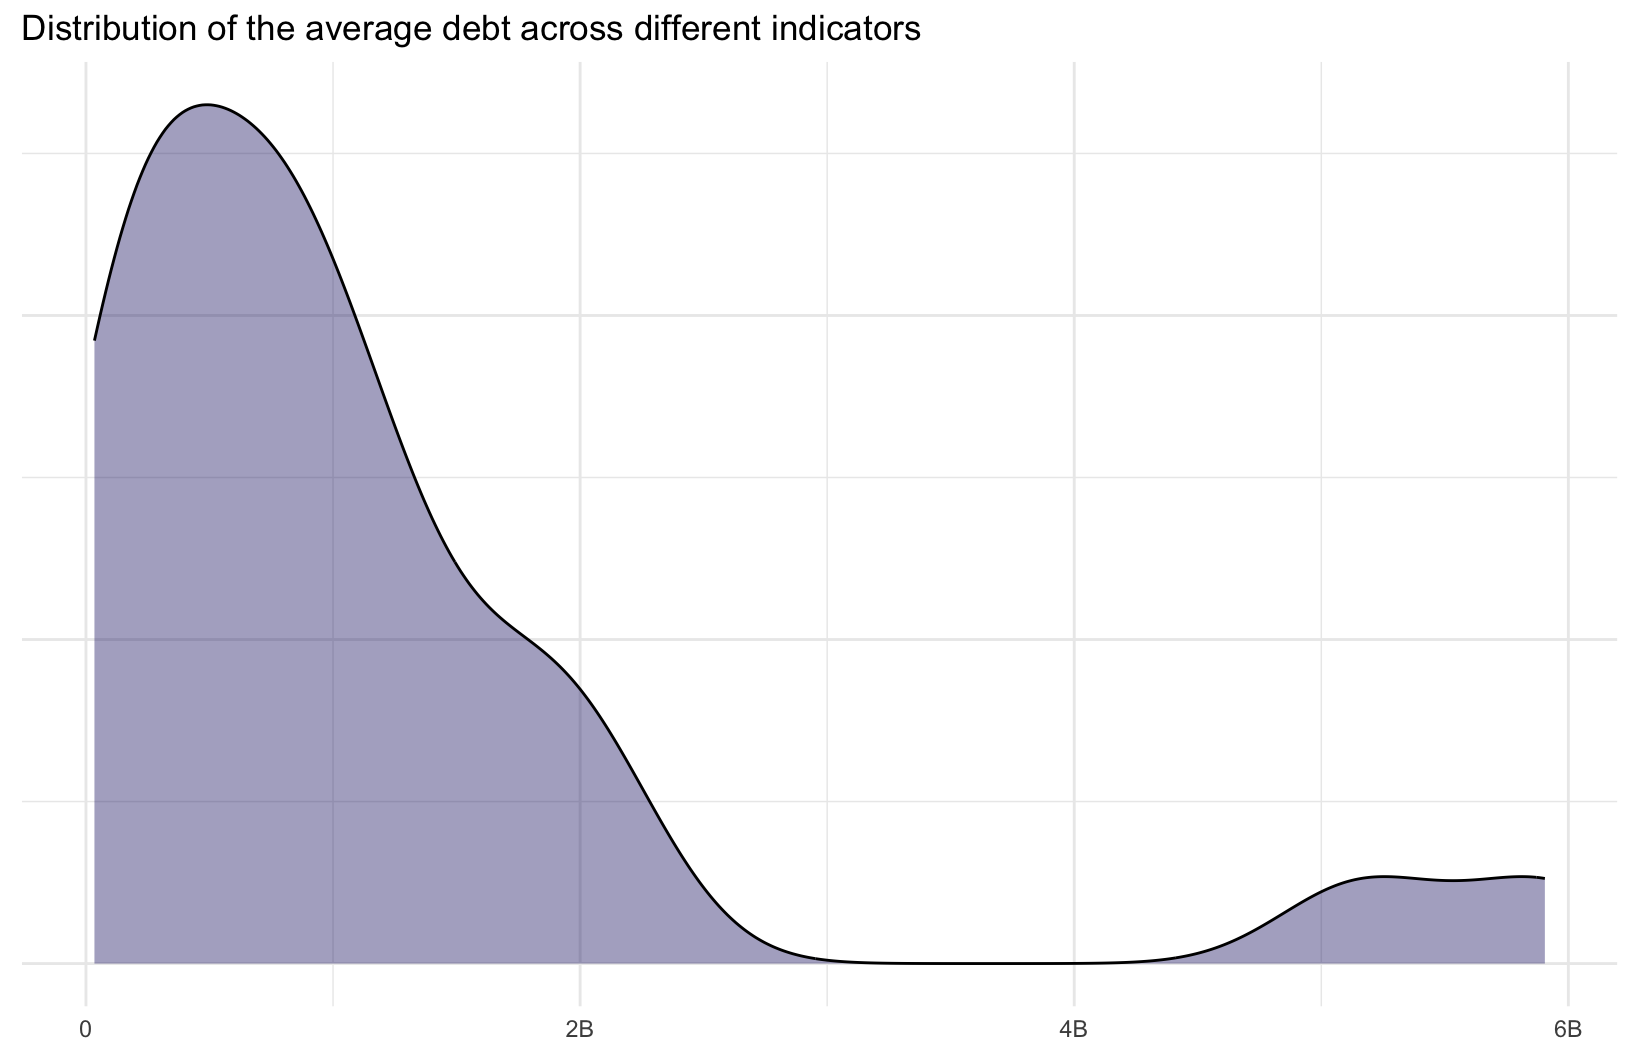
One may notice that principle repayment of long term debts tops the table of average debt and debt proportion of China. As such, we can find the top 10 countries with highest amount of debt in the category of long term debts (DT.AMT.DLXF.CD)
SELECT DISTINCT country_name
FROM international_debt
WHERE country_name IN (
    SELECT country_name
    FROM international_debt
    WHERE indicator_code = 'DT.AMT.DLXF.CD'
    ORDER BY debt DESC
    LIMIT 10
)| country_name |
|---|
| Indonesia |
| Turkey |
| China |
| India |
| Kazakhstan |
| Russian Federation |
| Brazil |
| South Asia |
| Mexico |
| Least developed countries: UN classification |
We saw that long-term debt is the topmost category when it comes to the average amount of debt. But is it the most common indicator in which the countries owe their debt?
SELECT indicator_name, COUNT(indicator_name) As n_indicator
FROM international_debt
GROUP BY indicator_name
ORDER BY n_indicator DESC| indicator_name | n_indicator |
|---|---|
| PPG, multilateral (INT, current US)|124||Principalrepaymentsonexternaldebt, long − term(AMT, currentUS) | 124 |
| Interest payments on external debt, long-term (INT, current US)|124||PPG, officialcreditors(INT, currentUS) | 124 |
| PPG, multilateral (AMT, current US)|124||PPG, officialcreditors(AMT, currentUS) | 124 |
| Disbursements on external debt, long-term (DIS, current US)|123||PPG, officialcreditors(DIS, currentUS) | 122 |
| PPG, bilateral (AMT, current US)|122||PPG, bilateral(INT, currentUS) | 122 |
| PPG, multilateral (DIS, current US)|120||PPG, bilateral(DIS, currentUS) | 113 |
| PPG, private creditors (AMT, current US)|98||PPG, privatecreditors(INT, currentUS) | 98 |
| PPG, commercial banks (INT, current US)|84||PPG, commercialbanks(AMT, currentUS) | 84 |
| Principal repayments on external debt, private nonguaranteed (PNG) (AMT, current US)|79||Interestpaymentsonexternaldebt, privatenonguaranteed(PNG)(INT, currentUS) | 79 |
| PPG, bonds (AMT, current US)|69||PPG, bonds(INT, currentUS) | 69 |
| PPG, other private creditors (INT, current US)|54||PPG, otherprivatecreditors(AMT, currentUS) | 54 |
| PPG, private creditors (DIS, current US)|53||PPG, commercialbanks(DIS, currentUS) | 51 |
| PPG, other private creditors (DIS, current US$) | 19 |
Turns out it is the second most common category of debt. But what is the average amount of the most common debt type, DT.INT.OFFT.CD?
SELECT avg(debt) as mean_debt
FROM international_debt
WHERE indicator_code = 'DT.INT.OFFT.CD'| mean_debt |
|---|
| 297677339 |
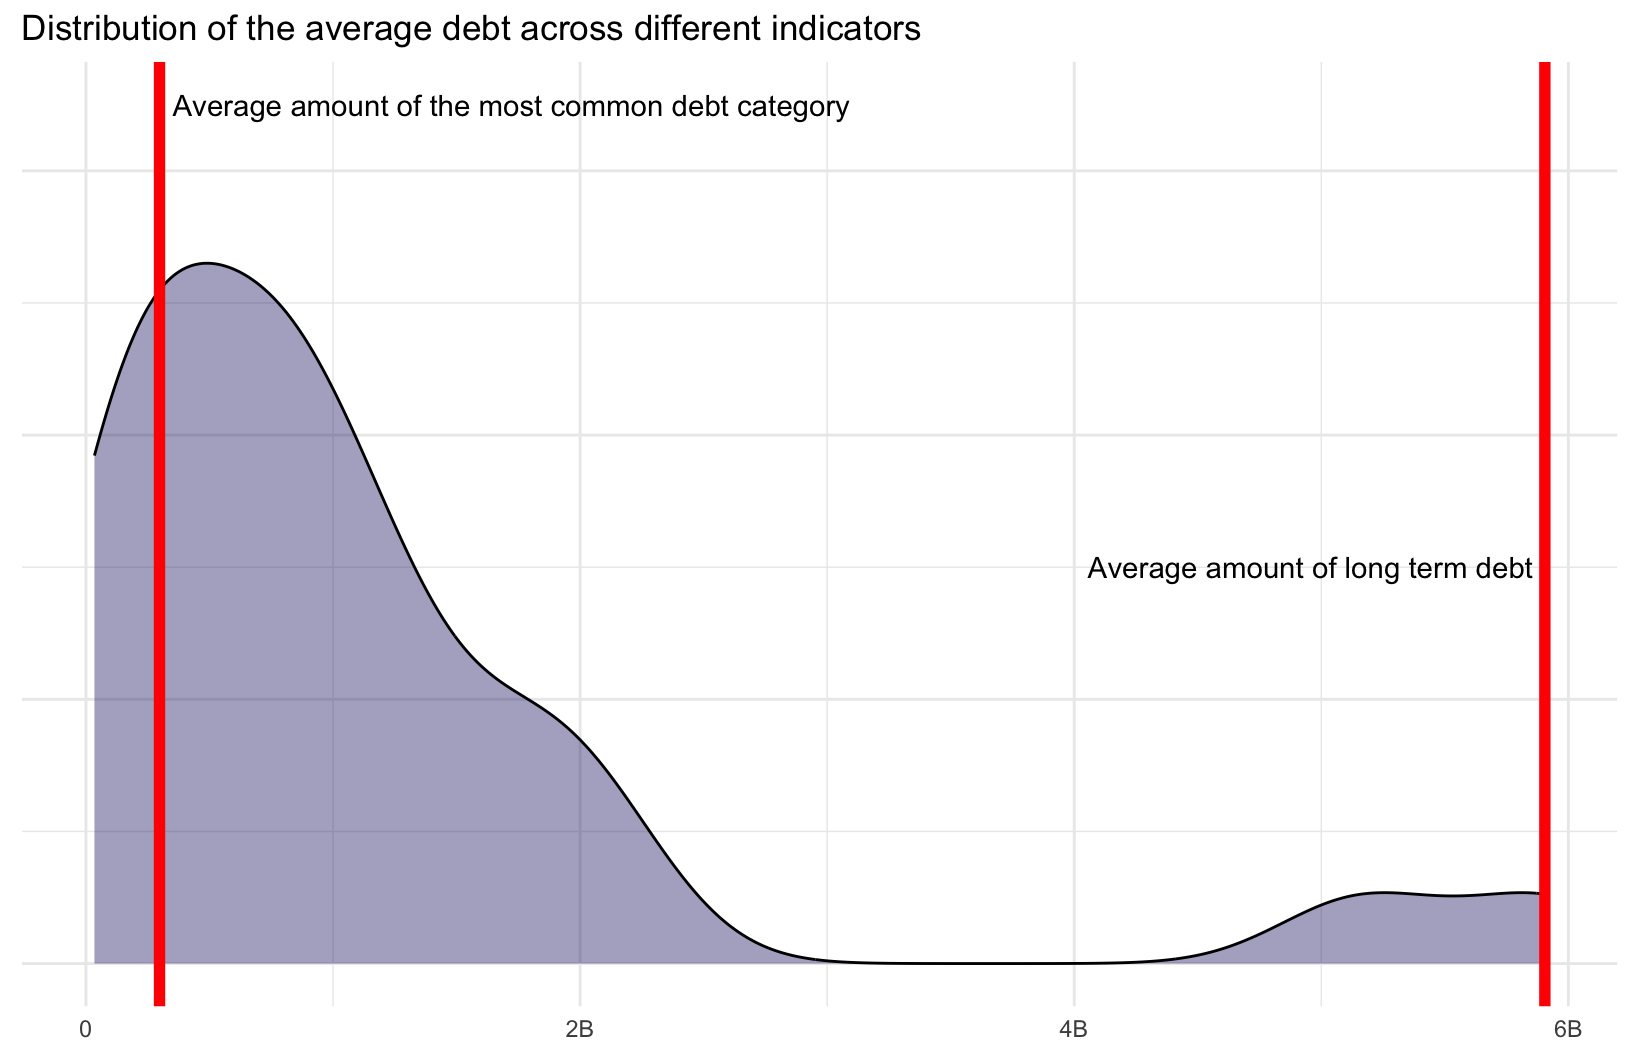
By inspecting the six indicators in which all the countries listed in our dataset have taken debt (n_indicator = 124), we have a clue that all these countries are suffering from some common economic issues. Another problem is what is the most serious issues each country has? We can look into this by retrieving maximum of debt of all categories of each country.
-- some countries have tied max debt on multiple categories
WITH max_debt AS (
    SELECT country_name, max(debt) AS maximum
    FROM international_debt
    GROUP BY country_name
    HAVING max(debt) <> 0
)
SELECT  max_debt.country_name, indicator_name, maximum FROM max_debt
  LEFT JOIN (SELECT country_name, indicator_name, debt FROM international_debt) AS debt
    ON max_debt.maximum = debt.debt
    AND max_debt.country_name = debt.country_name
ORDER BY maximum DESC
LIMIT 20| country_name | indicator_name | maximum |
|---|---|---|
| China | Principal repayments on external debt, long-term (AMT, current US)|9.622e + 10||Brazil|Principalrepaymentsonexternaldebt, long − term(AMT, currentUS) | 9.004e+10 |
| Russian Federation | Principal repayments on external debt, long-term (AMT, current US)|6.659e + 10||Turkey|Principalrepaymentsonexternaldebt, long − term(AMT, currentUS) | 5.156e+10 |
| South Asia | Principal repayments on external debt, long-term (AMT, current US)|4.876e + 10||Leastdevelopedcountries : UNclassification|Disbursementsonexternaldebt, long − term(DIS, currentUS) | 4.016e+10 |
| IDA only | Disbursements on external debt, long-term (DIS, current US)|3.453e + 10||India|Principalrepaymentsonexternaldebt, long − term(AMT, currentUS) | 3.192e+10 |
| Indonesia | Principal repayments on external debt, long-term (AMT, current US)|3.092e + 10||Kazakhstan|Principalrepaymentsonexternaldebt, long − term(AMT, currentUS) | 2.748e+10 |
| Mexico | Principal repayments on external debt, long-term (AMT, current US)|2.522e + 10||Cameroon|Disbursementsonexternaldebt, long − term(DIS, currentUS) | 1.819e+10 |
| Romania | Principal repayments on external debt, long-term (AMT, current US)|1.401e + 10||Colombia|Principalrepaymentsonexternaldebt, long − term(AMT, currentUS) | 1.199e+10 |
| Angola | Principal repayments on external debt, long-term (AMT, current US)|1.107e + 10||Venezuela, RB|Principalrepaymentsonexternaldebt, long − term(AMT, currentUS) | 9.879e+09 |
| Egypt, Arab Rep. | Principal repayments on external debt, long-term (AMT, current US)|9.692e + 09||Lebanon|Principalrepaymentsonexternaldebt, long − term(AMT, currentUS) | 9.507e+09 |
| South Africa | Principal repayments on external debt, long-term (AMT, current US)|9.474e + 09||Bangladesh|PPG, officialcreditors(DIS, currentUS) | 9.051e+09 |
Visualization: countries in most debt
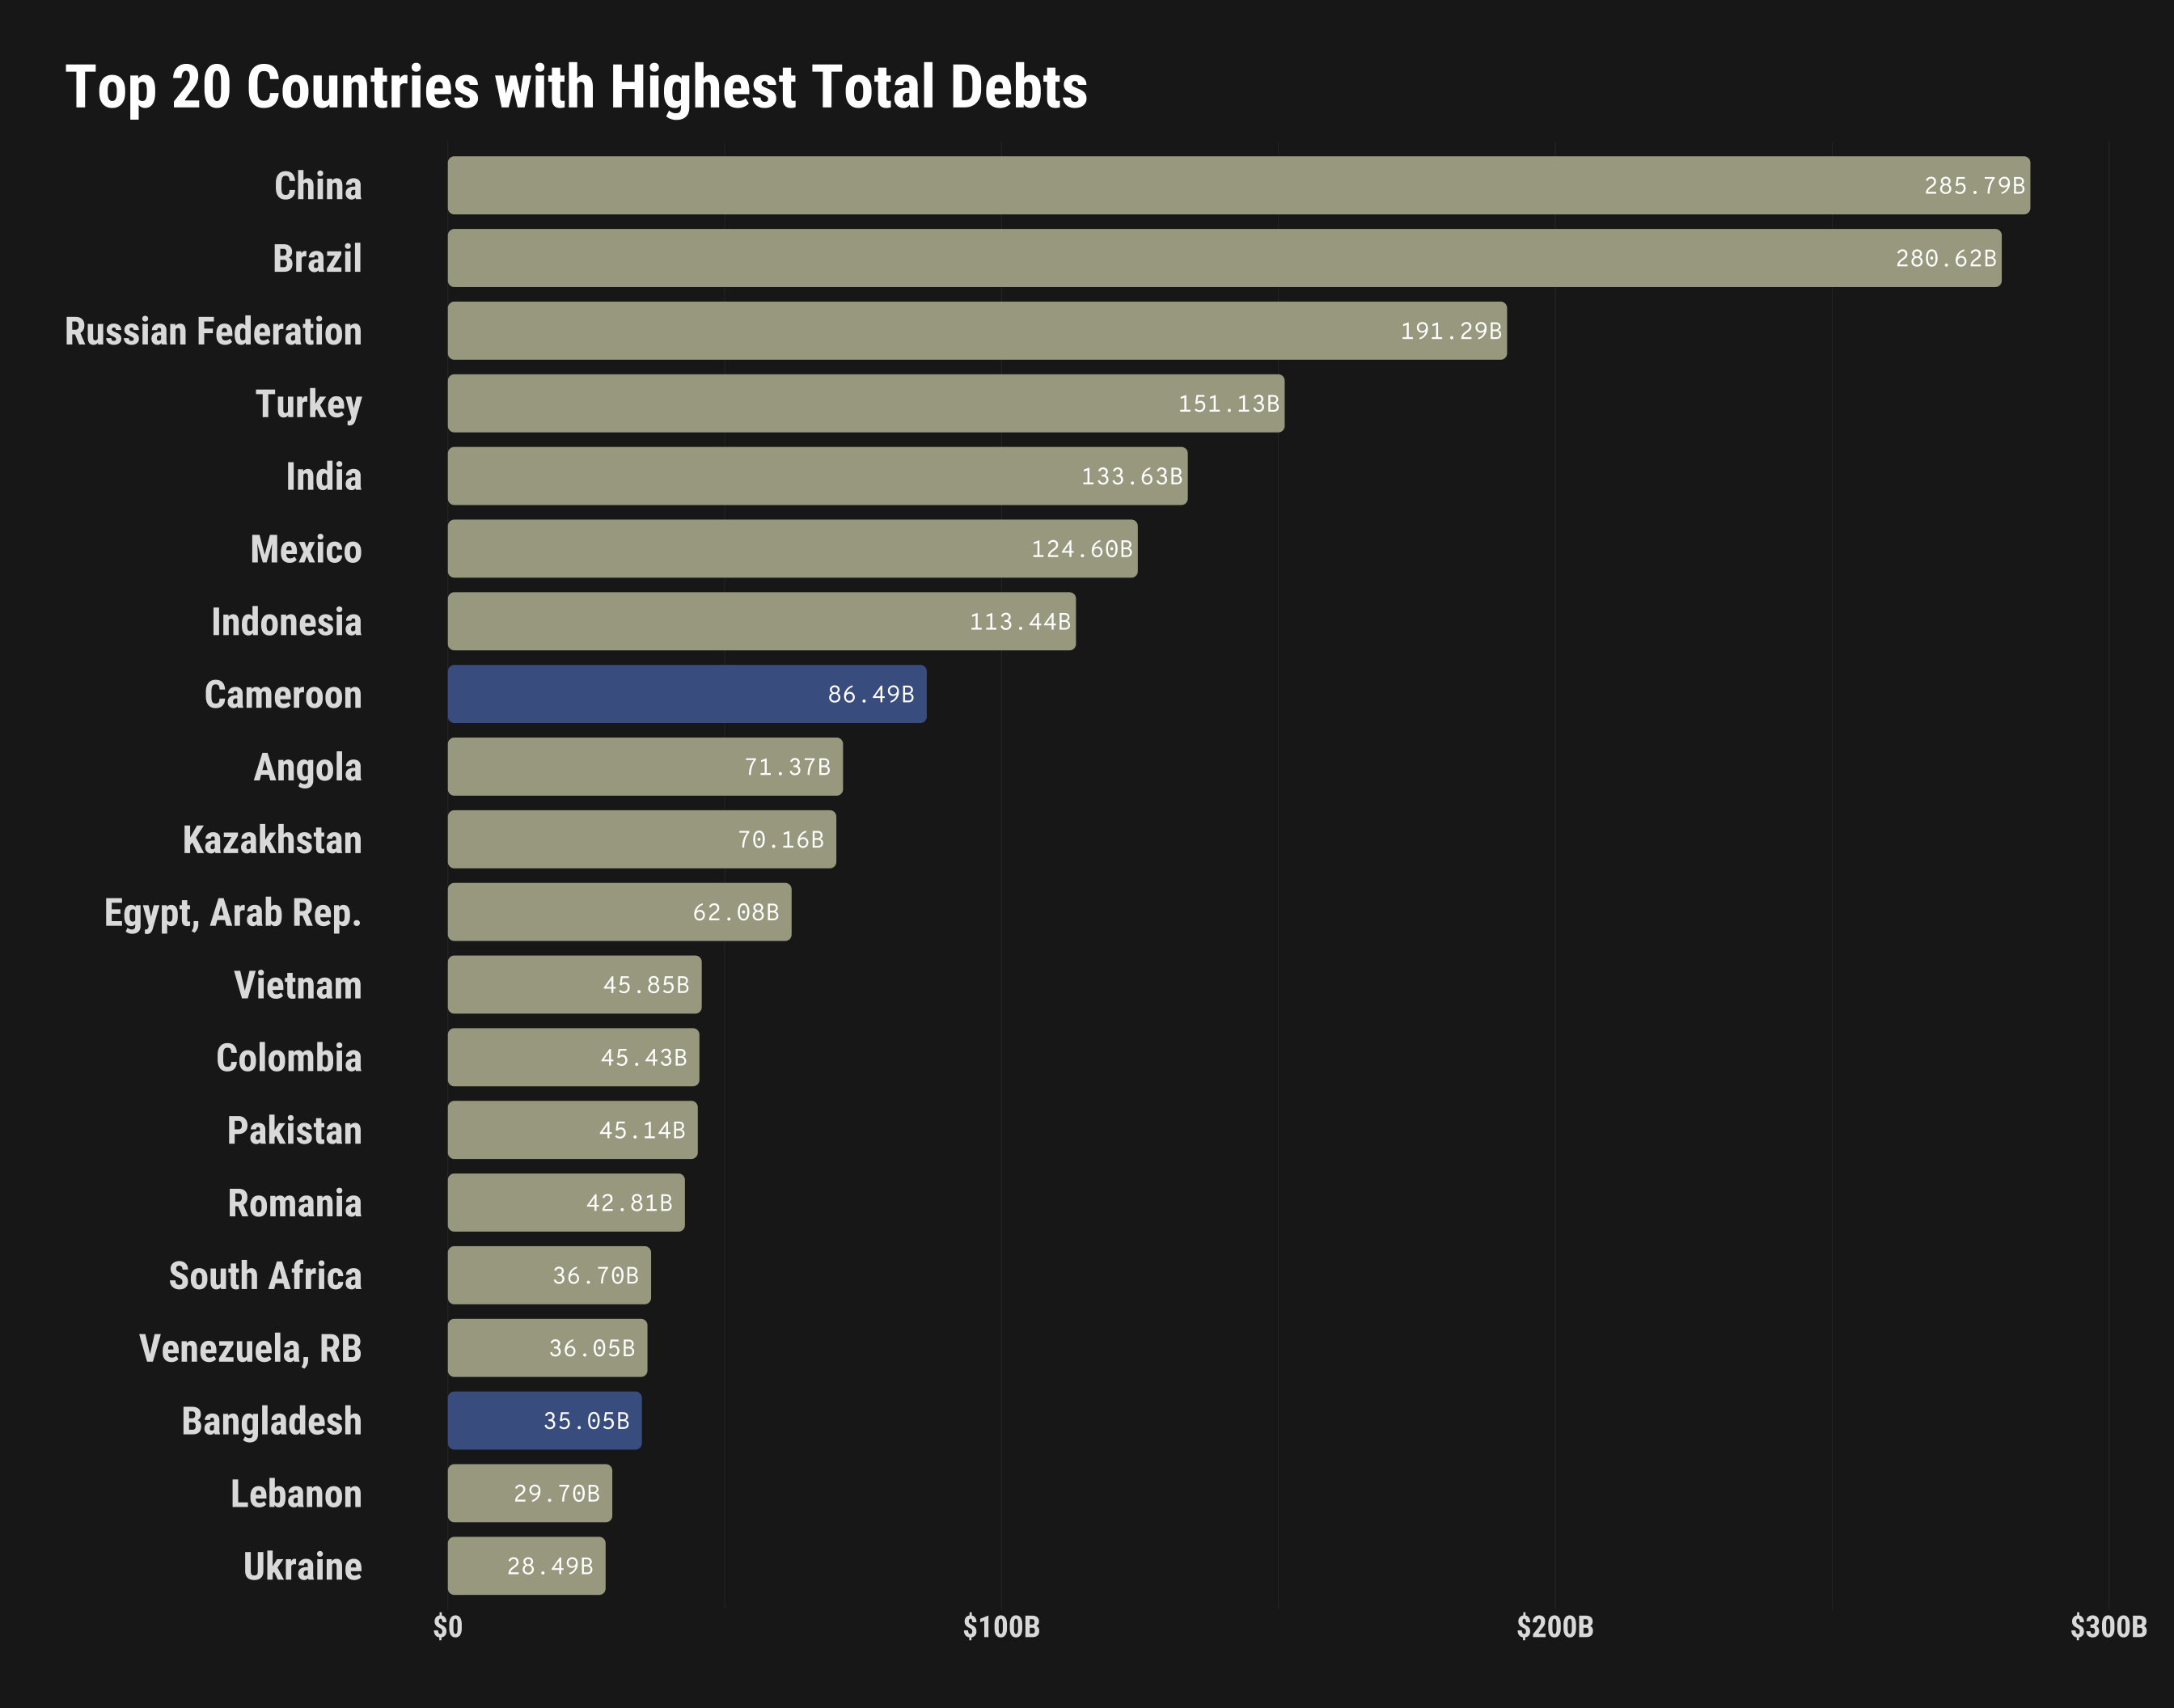
Finally, let’s make a plot again to show the top 20 countries with highest debt, as in table 1, plus the specific category in which they take highest debt in. This time I exclude non-country entries.
# prepare data for plot
maximum_category <- international_debt %>%
  group_by(country_name) %>%
  slice_max(order_by = debt, n = 1) %>%
  distinct(country_name, .keep_all = TRUE) %>%
  select(country_name, indicator_name)

countries <- international_debt %>%
  filter(!country_name %in% c(
    "South Asia",
    "Least developed countries: UN classification",
    "IDA only"
  )) %>%
  group_by(country_name) %>%
  summarize(total_debt = sum(debt)) %>%
  slice_max(order_by = total_debt, n = 20) %>%
  left_join(maximum_category)

countries
#> # A tibble: 20 × 3
#>    country_name          total_debt indicator_name
#>    <chr>                      <dbl> <chr>
#>  1 China              285793494734. Principal repayments on external debt, long…
#>  2 Brazil             280623966141. Principal repayments on external debt, long…
#>  3 Russian Federation 191289057259. Principal repayments on external debt, long…
#>  4 Turkey             151125758035. Principal repayments on external debt, long…
#>  5 India              133627060958. Principal repayments on external debt, long…
#>  6 Mexico             124596786217. Principal repayments on external debt, long…
#>  7 Indonesia          113435696694. Principal repayments on external debt, long…
#>  8 Cameroon            86491206347. Disbursements on external debt, long-term (…
#>  9 Angola              71368842500. Principal repayments on external debt, long…
#> 10 Kazakhstan          70159942694. Principal repayments on external debt, long…
#> 11 Egypt, Arab Rep.    62077727757. Principal repayments on external debt, long…
#> 12 Vietnam             45851299896. Principal repayments on external debt, long…
#> 13 Colombia            45430117605. Principal repayments on external debt, long…
#> 14 Pakistan            45139315399. Principal repayments on external debt, long…
#> 15 Romania             42813979498. Principal repayments on external debt, long…
#> 16 South Africa        36703940742. Principal repayments on external debt, long…
#> 17 Venezuela, RB       36048260108. Principal repayments on external debt, long…
#> 18 Bangladesh          35045492841. Disbursements on external debt, long-term (…
#> 19 Lebanon             29697872619. Principal repayments on external debt, long…
#> 20 Ukraine 28490304100. Principal repayments on external debt, long…ggplot(countries) +
geom_chicklet(
aes(
x = forcats::fct_reorder(country_name, total_debt),
y = total_debt,
fill = indicator_name
),
color = NA, width = 0.8
) +
geom_text(
aes(
country_name, total_debt,
label = sci_labeller(total_debt)),
color = "white", nudge_y = -10000000000, family = "Overpass Mono"
) +
scale_y_continuous(labels = label_number(scale_cut = cut_short_scale(), prefix = "$")) +
hrbrthemes::theme_modern_rc() +
nord::scale_fill_nord(palette = "afternoon_prarie", name = NA) +
coord_flip(clip = "off") +
labs(
x = NULL,
y = NULL,
title = "Top 20 Countries with Highest Total Debts"
) +
theme(
legend.position = "none",
plot.title = element_text(size = 28, family = "Roboto Condensed"),
plot.title.position = "plot",
plot.subtitle = element_markdown(family = "Roboto Condensed"),
axis.text.x = element_text(face = "bold", size = 14),
axis.text.y = element_text(face = "bold", size = 18),
panel.grid.major.y = element_blank()
)